Pandas, the clutch type library
While working on my script from my last post, I discovered the Pandas library for Data science in python. I ran acrosss this while trying to handle the data that my script was pulling in from both mysql and dynamodb so that I could collate the data better. Turns out that pandas is actually a pretty clutch library.
To explain why I love pandas so much, we’re going to follow an example from Towards Data Science
In their post, they have this dataset 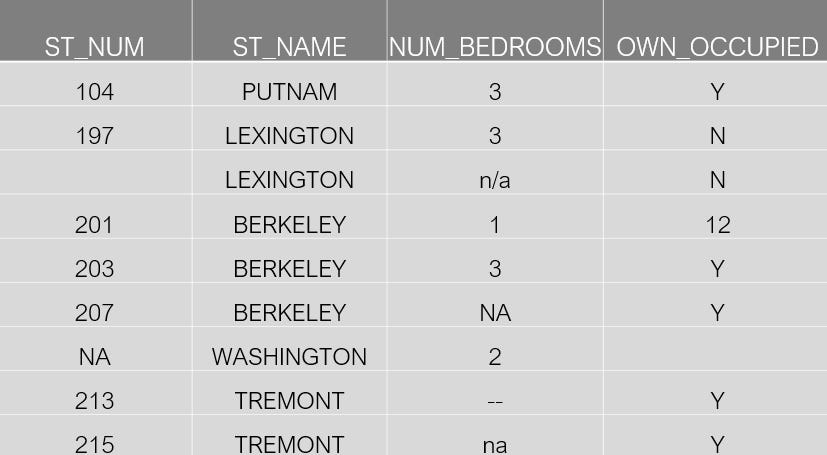
Thankfully neither they nor I are going to make you recreate that by yourself, as they provided the CSV file for us.
Using that CSV file, we’re able to load it into a pandas dataframe using read_csv(), one of the several IO tools available. I’ve taken the liberty of renaming the file to property_data.csv just to remove the space.
1 | #!/usr/bin/python |
Now let’s say that we wanted to see the first 7 or the last 7 rows in the data frame, we would accomplish that with
1 | df.head(7) |
         PID      ST_NUM     ST_NAME OWN_OCCUPIED NUM_BEDROOMS  NUM_BATH SQ_FT
0  100001000.0   104.0      PUTNAM            Y            3        1  1000
1  100002000.0   197.0   LEXINGTON            N            3      1.5    --
2  100003000.0     NaN   LEXINGTON            N          NaN        1   850
3  100004000.0   201.0    BERKELEY           12            1      NaN   700
4       NaN      203.0    BERKELEY            Y            3        2  1600
5  100006000.0   207.0    BERKELEY            Y          NaN        1   800
6  100007000.0     NaN  WASHINGTON          NaN            2   HURLEY   950
1 | df.tail(7) |
       PID      ST_NUM     ST_NAME OWN_OCCUPIED NUM_BEDROOMS  NUM_BATH SQ_FT
2  100003000.0     NaN   LEXINGTON            N          NaN        1   850
3  100004000.0   201.0    BERKELEY           12            1      NaN   700
4          NaN   203.0    BERKELEY            Y            3        2  1600
5  100006000.0   207.0    BERKELEY            Y          NaN        1   800
6  100007000.0     NaN  WASHINGTON          NaN            2   HURLEY   950
7  100008000.0   213.0     TREMONT            Y            1        1   NaN
8  100009000.0   215.0     TREMONT            Y           na        2  1800
One thing to note is that both head and tail default to 5 rows. Of course, we may not always know what exactly our data looks like so to get an idea of it, we can use
1 | df.shape |
(9, 7)
Which tells us that we have 9 rows and 7 columns.
“But Lance!” I hear you say, “You’ve only shown us how to some rows, what about getting other pieces of information?” Fear not friends! Pandas also has the ability to understand and manipulate text.
To explain that, look back at the original dataset, There are a number of NaNs in it which in pandas is a Null value or Not available. Suppose for a moment that you needed to send that CSV to a production machine but because the CSV you were given had those values, sending it would cause massive issues. Forunately, there is a solution to this, isnull()
1 | df.isnull() |
     PID  ST_NUM  ST_NAME  OWN_OCCUPIED  NUM_BEDROOMS  NUM_BATH  SQ_FT
0  False   False    False         False         False     False  False
1  False   False    False         False         False     False  False
2  False    True    False         False          True     False  False
3  False   False    False         False         False      True  False
4   True   False    False         False         False     False  False
5  False   False    False         False          True     False  False
6  False    True    False          True         False     False  False
7  False   False    False         False         False     False   True
8  False   False    False         False         False     False  False
That’s pretty nice looking for sure, but wouldn’t it be better if we could just have a single value?
1 | df.isnull().values.any() |
True
Now that’s a bit more like it! Before we kick it up a notch emeril style, let’s take a step back and examine some other ways of looking at data with pandas. In particular, I want to show the loc() and iloc() methods off.
loc() and iloc() are two methods for pulling out specific pieces of data from a panda dataframe. loc() gets based on labels allowing one to specify a column name such as ST_NAME and a row number to get that piece of data.
1 | df.loc[1,'ST_NAME'] |
'LEXINGTON'
iloc() on the other hand works based on intergers.
1 | df.iloc[1,2] |
'LEXINGTON'
Now back to our scenario, not every row would break our production system, just the ones with Null chracters, so using pandas, it’s entirely possible to check through the row to make sure it has the informaiton we need.
1 | df.loc[1].isnull().values.any() |
True
And to add that extra niceness, let’s say we knew at least one column could be empty, we can account for that using pandas.
1 | df.loc[3, df.columns != 'NUM_BATH'].isnull().values.any() |
False
As you can see, pandas is a pretty powerful library and while it’s intended for Data Science and Big Data, that doesn’t mean that you can’t take advantage of it in your own programs. What I’ve shown here is only a drop in the bucket for the capabilities this library has. Hopefully this has given you an idea of how useful it can be for your projects!